On this page
- How to open Activity Monitor on a Mac
- How to force quit an app from Activity Monitor
- What each tab shows
- Processes that look alarming but aren't
- Using Activity Monitor to find out why a Mac is slow
- Is there a Task Manager on Mac?
- What is the Ctrl Alt Delete for Mac?
- Why is Activity Monitor showing CPU over 100 percent?
- Can Activity Monitor show what's using disk space?
The Mac's task manager is Activity Monitor. It lives in Applications > Utilities, and the quickest way to open it is to press Cmd + Space, type "Activity Monitor" and press Return. It shows every running process with its CPU, memory, energy, disk and network use, and it can force quit anything that's stuck. There's no Ctrl + Alt + Delete on a Mac; the nearest shortcut is Option + Cmd + Esc, which opens the smaller Force Quit window.
This guide covers how to open Activity Monitor, what each tab tells you, and how to use it to find out why a Mac is slow.
How to open Activity Monitor on a Mac
Any of these works:
- Spotlight: press Cmd + Space, type
Activity Monitor, press Return. - Finder: open Applications, then Utilities, then double-click Activity Monitor.
- Launchpad or the Apps view: on macOS 15 and earlier open Launchpad and look in the Other folder. On macOS 26 and later Launchpad is gone; open Spotlight's Apps view and search there.
If you use it often, right-click its Dock icon while it's open and choose Options > Keep in Dock. The Dock icon can also show a live CPU graph: with Activity Monitor open, choose View > Dock Icon > Show CPU Usage.
How to force quit an app from Activity Monitor
- Select the app in the list. Type its name in the search box at the top right if the list is long.
- Click the X (stop) button in the toolbar.
- Click Quit to close it normally, or Force Quit if it isn't responding.
For a faster route when an app is frozen, press Option + Cmd + Esc, select the app and click Force Quit. Force quitting loses unsaved changes in that app, so try a normal Quit first when the app is still responding.
What each tab shows
CPU. How hard the processor is working, per process. Sort by % CPU to see what's busy. A process at 100 percent or more for minutes (the figure can exceed 100 on multi-core Macs) is either doing real work, such as an export, or stuck. The graph at the bottom shows overall load split into System and User.
Memory. How much RAM each process is using. The figures to read are at the bottom: Memory Pressure (green is fine, yellow means macOS is compressing memory to cope, red means it's swapping to disk) and Swap Used. High Memory Used on its own is normal on a Mac. Our guide on how to clear RAM on a Mac goes through this tab in detail.
Energy. Which apps are draining the battery, as an Energy Impact score, with a 12-hour history. App Nap shows which apps macOS has paused in the background. Useful on a laptop that's running hot or dying early.
Disk. Bytes read and written per process. A process writing gigabytes while you're doing nothing is usually a backup, a sync client such as iCloud, Dropbox or OneDrive, or Spotlight indexing. It doesn't show what's stored on the disk; for that, see how to check storage on a Mac.
Network. Bytes sent and received per process. Good for catching an app uploading in the background, and for confirming that the sync client really has finished.
Processes that look alarming but aren't
| Process | What it is |
|---|---|
kernel_task |
macOS itself. High CPU here is the Mac deliberately keeping itself cool by taking CPU time away from apps. Check the vents and the ambient temperature rather than force quitting it, which you can't do anyway |
WindowServer |
Draws everything on screen. High use with many windows, external displays or transparency effects is normal |
mds_stores, mdworker |
Spotlight indexing. Busy after a big file copy, a migration or a macOS update; it settles within hours |
photoanalysisd, mediaanalysisd |
Photos scanning your library for faces and objects. Runs while the Mac is idle and plugged in |
cloudd, bird |
iCloud sync |
syspolicyd, XprotectService |
Security checks on newly downloaded apps |
coreaudiod |
Audio. Spikes with some audio interfaces and virtual devices |
Quitting any of these does nothing useful; macOS relaunches them.
Using Activity Monitor to find out why a Mac is slow
Check the tabs in this order:
- Memory tab, bottom panel. If Memory Pressure is red or Swap Used is several gigabytes, memory is the bottleneck. Sort by Memory and quit the top few apps.
- CPU tab, sorted by % CPU. One process pinned high is the second most common cause. If it's an app, quit and relaunch it. If it's
kernel_task, the Mac is hot. - Disk tab. Sustained writes from a sync or backup client explain a slow Mac that's otherwise idle. Wait for it to finish, or pause it.
- Energy tab. On a laptop, the apps with the highest Energy Impact are the ones to close when you're on battery.
If none of the tabs shows anything, the cause is often outside Activity Monitor: a nearly full startup disk, too many login items, or a macOS update waiting to install. Why is my Mac so slow covers those in the order to check them.
Is there a Task Manager on Mac?
Yes. Activity Monitor is the Mac's Task Manager. It's in Applications > Utilities, shows CPU, memory, energy, disk and network use per process, and can force quit apps. The Force Quit window (Option + Cmd + Esc) is a smaller version that only lists apps and only quits them.
What is the Ctrl Alt Delete for Mac?
The closest Mac equivalent of Ctrl + Alt + Delete is Option + Cmd + Esc, which opens the Force Quit Applications window. For the full process list, open Activity Monitor instead. There's no single shortcut for locking the screen from that menu; use Ctrl + Cmd + Q to lock.
Why is Activity Monitor showing CPU over 100 percent?
Activity Monitor reports CPU per core, so on an 8-core Mac a process can show up to 800 percent. A single-threaded task pinned at 100 percent is using one core fully, which is normal for an export or a compile. The overall load graph at the bottom of the CPU tab is the figure to compare against 100.
Can Activity Monitor show what's using disk space?
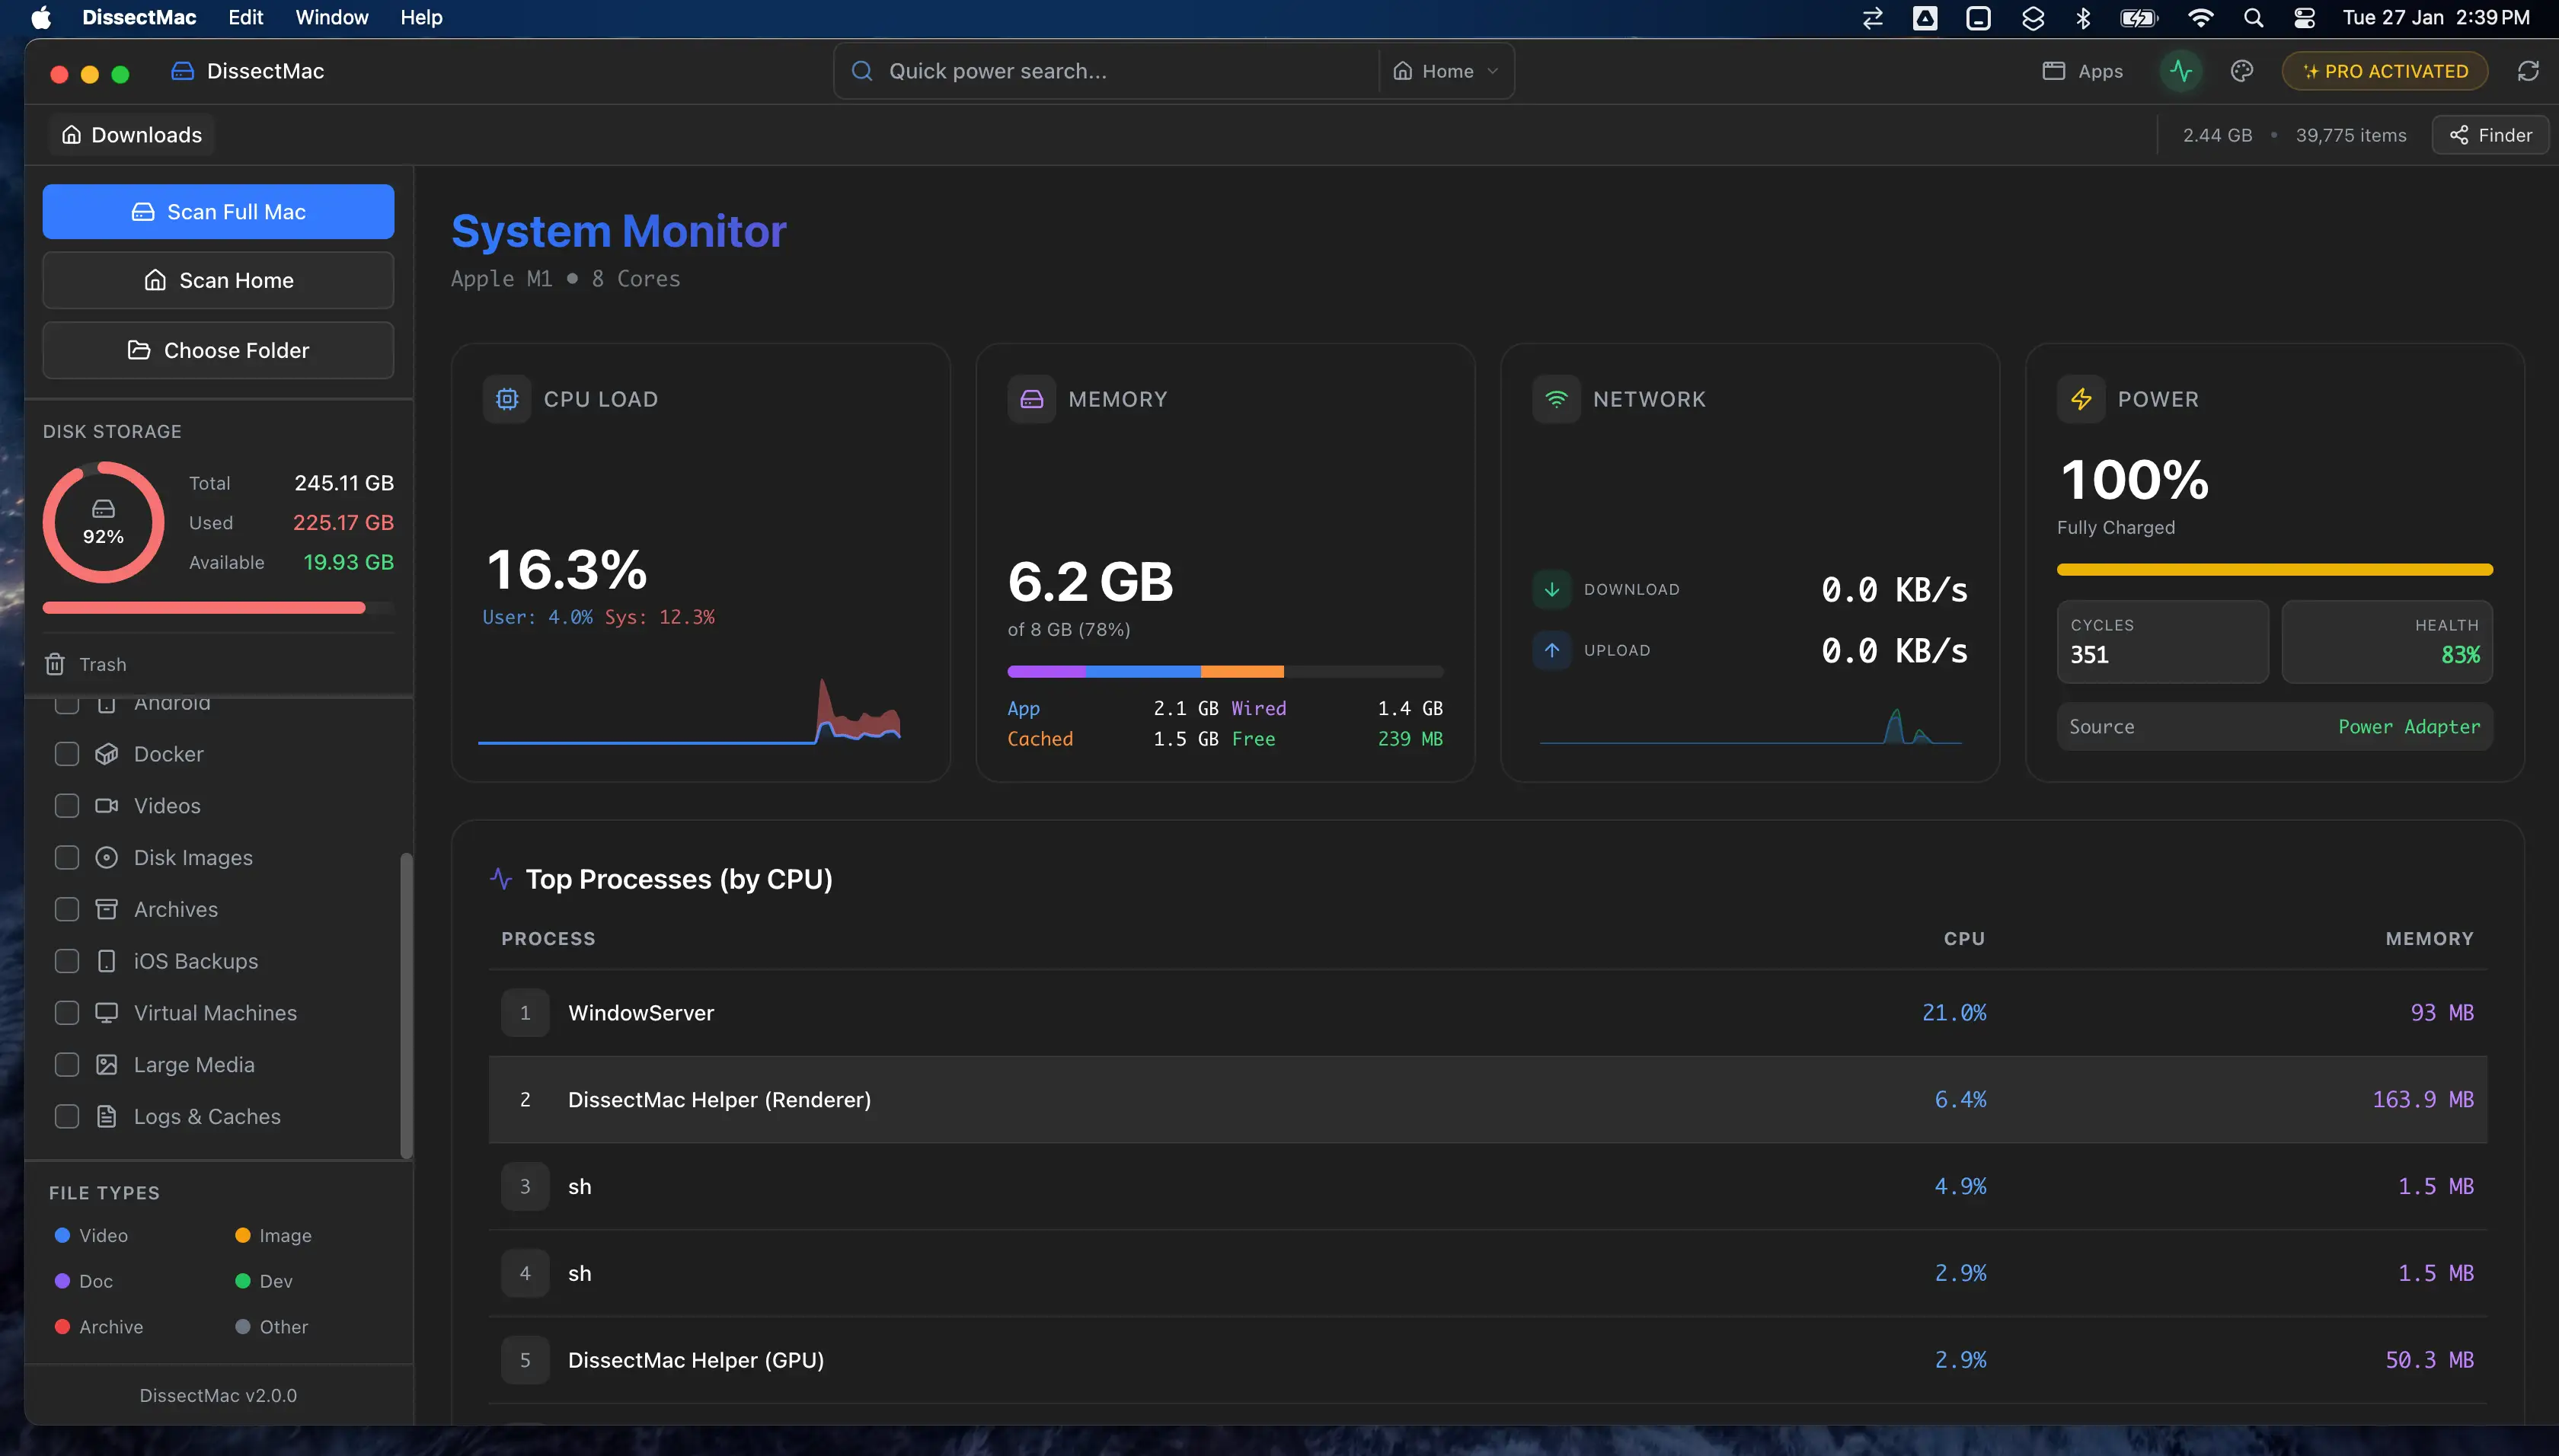
No. The Disk tab shows read and write activity, not what's stored. To see what's using disk space, use the Storage panel in System Settings, or a disk map such as DissectMac, which draws every folder to scale so the big ones are obvious.
More guides
Speed
Why Is My Mac So Slow? 8 Causes and How to Fix Each One
A slow Mac usually has one of 8 causes: a full disk, memory pressure, a runaway process, login items, heat or old hardware. Find yours in 5 minutes and fix it.
Speed
"Your System Has Run Out of Application Memory" on Mac: What It Means and How to Fix It
The 'your system has run out of application memory' alert means macOS ran out of RAM and swap. What causes it, the app to force quit first, and how to stop it.
Speed
How to Stop Apps From Opening on Startup on a Mac
Stop apps opening at startup on a Mac: remove them from Login Items, turn off background items, untick Reopen windows, and find the launch agents that hide.
Speed
How to Clear RAM on a Mac (and Why Memory Cleaners Don't Help)
How to free up RAM on a Mac: find what's using memory in Activity Monitor, quit it, cut tabs and login items, and why sudo purge and memory cleaners don't help.